How to use MSSQL Activity Monitor to find the most expensive query
There are certain ways to identify and troubleshoot long running queries.This prevents potential performance issues.
SQL Activity Monitor is the easiest and rich UI tool available in SQL Server Management Studio.It provides information about processor time, waiting tasks, database I/O, and batch requests, and recent expensive queries.
The following steps describes how to identify the recent expensive queries.
- Login into your Windows VPS via RDP.
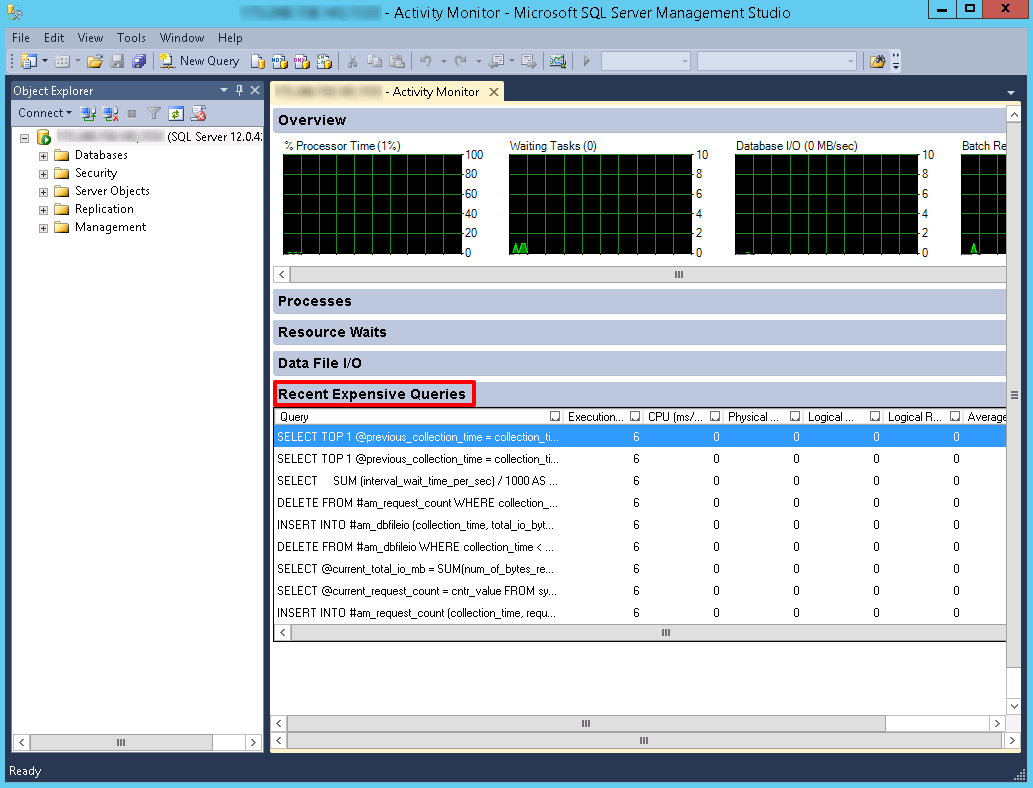
- Open MSSQL Management Studio and login as “sa” user. Click on the activity monitor icon shown in below image.

3. The information about the CPU,RAM,disk and execution time of each query can be analyzed on SQL activity monitor.The queries with highest resource usage and maximum time execution queries are displayed in “Recent Expensive Queries”.
4. Mouse hover to the query column to read the complete query.You need to optimize the query as much as possible to reduce the execution time and resource usage.You can directly edit the query in a text editor.Right-click the query and click on “Edit Query Text.”

5. The CPU(ms/sec) column shows how much processor time is used by query since the last compilation.It’s the ratio of processor time used by the query per second.
Related Articles
Fix :: Operation must use an updateable query." for ASP pages
Fix :: Operation must use an updateable query." for ASP pages Problem Statement Operation must use an updateable query." for ASP pages Cause There might be several reasons for this error. One of the most common reason is inappropriate permissions. ...Plesk Server Health Monitor
Plesk Server Health Monitor Overview Health Monitor helps you keep your Plesk installation running smoothly by keeping track of the system resources’ usage on the server and notifying you when one or more resources’ usage reaches a pre-defined ...How to create a Mysql or MSSQL DB in Plesk Panel
Steps to create a DB and a DB user in Plesk Step 1: Login To the Plesk control panel. Step 2: Go to the DB. Step 3: Next page click Add DB Step 4: Assign a name to your DB within the DB name field and select the DB server Mysql or MSSQL from the ...How to monitor bandwidth usages for a PRTG sensors
1. Log in to the admin panel using given URL and User-id/Password given to you: prtg.diadem-tech.com 2. Then click on Devices button. 3. Next go to the sensors and click on it. 4. Now you can monitor bandwidth usages from here.How to install Server Health Monitor, watchdog in Plesk
Installing Health Monitor and Watchdog Health monitor in monitoring and keeping track of the server resources and notifying the admin if the resources crosses the threshold limit. Install Health Monitor Step 1: Installing Health Monitor To Install ...